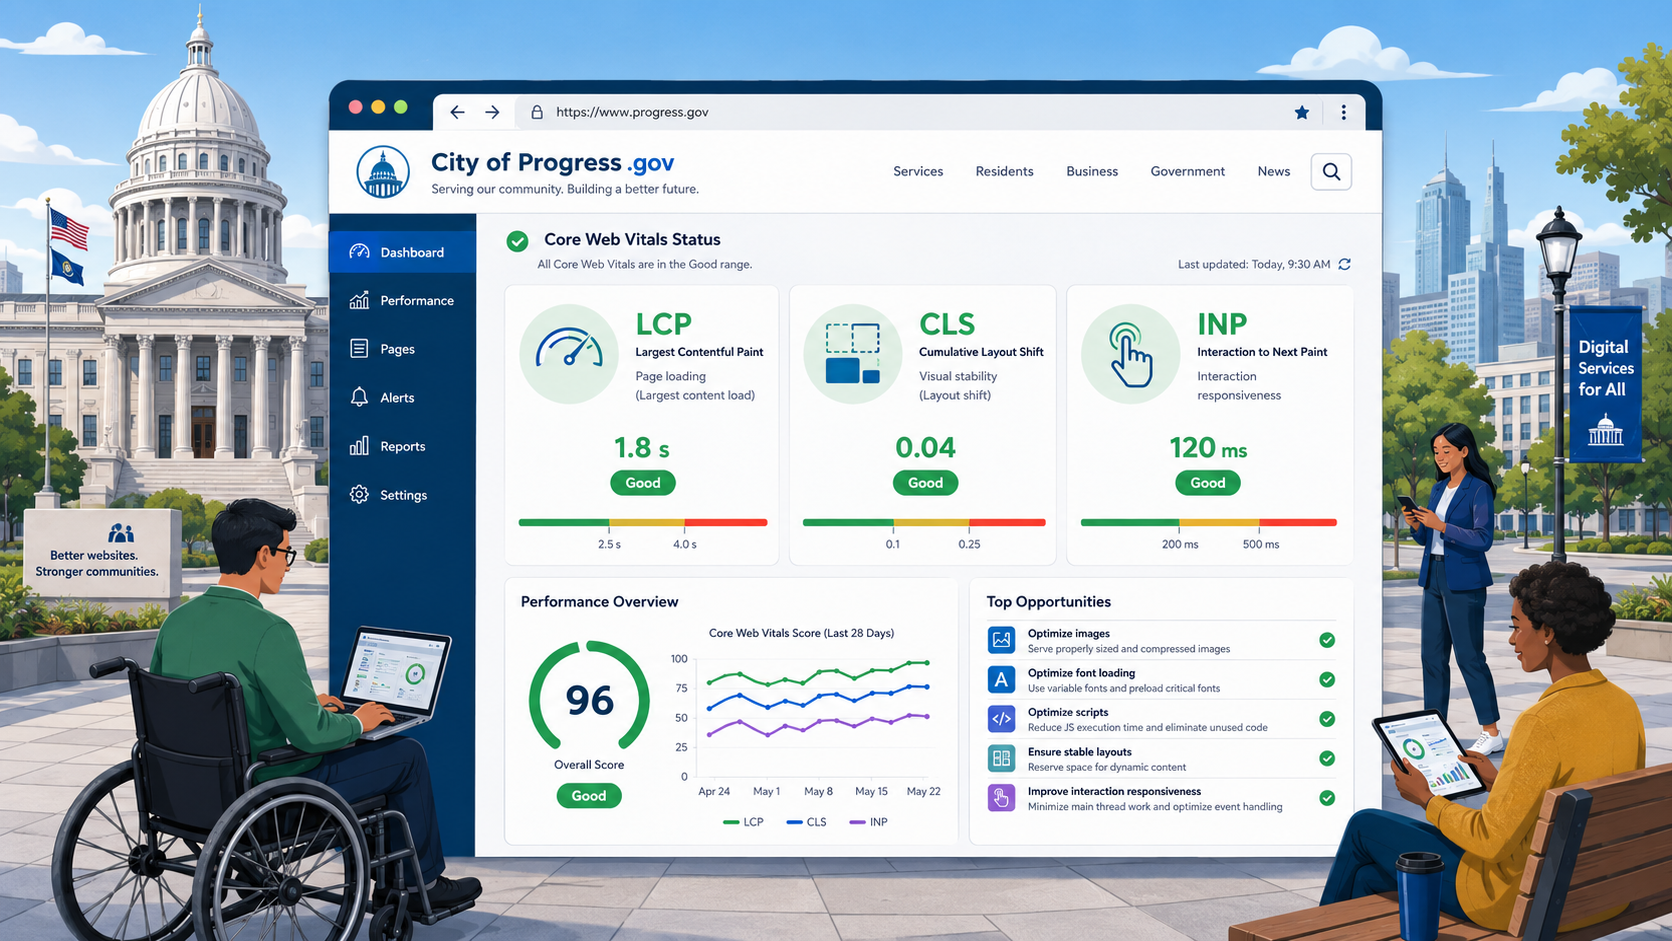
TL;DR: Core Web Vitals are three metrics Google uses to grade real-world site performance: Largest Contentful Paint (LCP, should be under 2.5 seconds), Cumulative Layout Shift (CLS, should be under 0.1), and Interaction to Next Paint (INP, should be under 200 milliseconds). For government websites these matter twice over: they affect search visibility and they are an equity issue, because slow sites disproportionately exclude users on older devices and slower connections. Measure with PageSpeed Insights, Chrome User Experience Report, and Lighthouse. The most common public-sector failures are huge unoptimized images, render-blocking CMS scripts, and layout shifts from cookie banners and ads.
Performance is often treated as a “nice to have” on government websites - secondary to accessibility, security, and content. That framing is wrong. A government website that takes eight seconds to load on a five-year-old Android phone is failing the residents who most need its services: people without broadband, people on prepaid mobile plans, people with older hardware, people in rural areas with weak signal, and people accessing the site from public libraries and community centers.
Core Web Vitals are how modern browsers measure those failures, and they are the right starting point for performance work on any public-sector site.
What Core Web Vitals Measure
Google defined Core Web Vitals as a small, stable set of metrics that measure the user experience as it actually happens in real browsers, on real devices, on real networks. There are currently three.
Largest Contentful Paint (LCP)
LCP measures how long it takes for the largest visible element in the viewport - usually a hero image, a banner, or a large block of text - to render. It is a proxy for “the main content has loaded.”
- Good: under 2.5 seconds.
- Needs improvement: 2.5 to 4.0 seconds.
- Poor: over 4.0 seconds.
LCP is measured at the 75th percentile of page loads across mobile and desktop. If 25 percent of your users see LCP over 2.5 seconds, you fail.
Cumulative Layout Shift (CLS)
CLS measures unexpected layout shifts during the lifetime of the page - the frustrating experience of trying to click a link and having it jump out from under your finger because an ad or banner loaded late.
- Good: under 0.1.
- Needs improvement: 0.1 to 0.25.
- Poor: over 0.25.
CLS is unitless. It is calculated as the impact fraction (how much of the viewport was affected) multiplied by the distance fraction (how far the affected elements moved).
Interaction to Next Paint (INP)
INP replaced First Input Delay (FID) in March 2024 as a Core Web Vital. It measures the latency between any user interaction (click, tap, keypress) and the next paint that visually responds to it.
- Good: under 200 ms.
- Needs improvement: 200 to 500 ms.
- Poor: over 500 ms.
INP is the metric most directly affected by heavy JavaScript - which means it is often the worst metric on government sites loaded down with CMS plugins, vendor scripts, and analytics.
Why This Matters for Government
Equity and Access
The single most important reason for government to care about Core Web Vitals is that performance is an access issue. A 2024 Pew study found that roughly 15 percent of US adults are “smartphone only” internet users, disproportionately lower-income and rural. Those users are typically on cheaper Android devices with slower CPUs, less memory, and metered data plans. A page that takes 60 KB and renders in two seconds on a fiber-connected MacBook can take 3 MB and 18 seconds on a $150 Android phone over a congested LTE connection.
If your government site fails Core Web Vitals, you are systematically failing the residents who have the fewest alternatives.
Search Visibility
Google’s Page Experience signals include Core Web Vitals. A page that meets the “good” thresholds is more likely to rank well, especially for searches that have many competing results - “renew driver license,” “apply for SNAP,” “property tax payment.” Many residents find government services through search rather than direct navigation.
Service Delivery Costs
Slow pages cause abandonment. Every abandoned online transaction means the resident either gives up or calls the agency, drives to an office, or mails a paper form - all of which cost the agency more than the online transaction would have.
How to Measure Core Web Vitals
There are two kinds of measurement: lab data (synthetic tests run in a controlled environment) and field data (real user measurements). Core Web Vitals are officially measured with field data.
PageSpeed Insights
pagespeed.web.dev is the simplest tool. Paste in a URL and it returns both lab data (from Lighthouse) and field data (from the Chrome User Experience Report, or CrUX). Field data is only available for pages with enough real-world traffic in Chrome. For low-traffic government pages, you will only see lab data.
Chrome User Experience Report (CrUX)
CrUX is the public dataset of real-world performance metrics from Chrome users who have opted in. You can query it directly through BigQuery, the CrUX API, or PageSpeed Insights. CrUX is the source of truth for Core Web Vitals at the URL, origin, and country level.
Lighthouse
Lighthouse is the lab tool built into Chrome DevTools. It runs the page in a simulated mobile environment and produces lab-data Core Web Vitals along with detailed diagnostics. Lab data does not always match field data - especially for INP, which depends on real user interaction patterns - but it is invaluable for debugging.
Web Vitals JavaScript Library
The web-vitals library lets you collect Core Web Vitals directly from your real users and send them to your analytics platform. This gives you the closest possible match to what Google sees in CrUX. For agencies running Google Analytics 4, the library can ship metrics as custom events with one or two lines of code.
Search Console
Google Search Console’s Core Web Vitals report aggregates CrUX data for your verified properties and groups URLs by status. It is the most efficient way to find which pages on your site need work.
Common Causes of Failure on Government Sites
Huge Unoptimized Hero Images
This is the most common LCP failure on government homepages. A 4 MB JPEG of the capitol building, the county seal, or a stock photo of a smiling family loads slowly and pushes LCP well over 2.5 seconds on mobile.
Fix: Use modern formats (AVIF, WebP) with JPEG fallback, serve responsive images using srcset and sizes, compress aggressively, and resize for the actual rendered dimensions. A hero image displayed at 1600x600 should not be served at 4000x2000.
Render-Blocking CSS and JavaScript
Many CMSes load multiple stylesheets and synchronous scripts before any content can render. The browser has to download and parse each of them before it can paint the LCP element.
Fix: Concatenate and minify CSS. Inline critical CSS for above-the-fold content. Add defer or async to JavaScript tags wherever possible. Audit and remove unused CMS plugins.
Layout Shifts from Banners and Ads
Cookie consent banners, COVID announcement banners, alert banners, ads, and embedded social media widgets are common CLS culprits. They load asynchronously, push down the content below, and produce a jarring shift.
Fix: Reserve space for any element that will load asynchronously. Use aspect-ratio or explicit width and height on images and iframes. Place banners at the top of the DOM and size them deterministically. See our cookie banner requirements guide for accessible, non-shifting patterns.
CMS Plugins and Vendor Scripts
A typical state agency homepage loads scripts from Google Analytics, a translation widget, a chatbot, a survey tool, a heatmap tool, a tag manager, a CDN provider, and three or four CMS plugins. Each one adds to the JavaScript main-thread work that INP measures.
Fix: Audit ruthlessly. For each third-party script, ask whether the value it provides justifies the performance cost. Consolidate analytics. Lazy-load chatbots so they only initialize on user interaction. Use a tag manager to avoid hardcoding tags into templates.
Web Fonts Loading Late
If a custom web font loads after the body text renders, the page may shift when the font finally applies (a problem called FOUT - flash of unstyled text). Custom fonts also delay LCP if the LCP element is text.
Fix: Use font-display: swap to allow the browser to render with a fallback font first. Preload the most important font files. Subset fonts to remove glyphs you do not use. Consider using a system font stack for body text and reserving custom fonts for headings.
Slow Origin Servers
Many government sites are still hosted on aging on-premises infrastructure, with cold caches, slow database queries, and no CDN in front. Time to First Byte (TTFB) on the order of 1500 milliseconds is unfortunately common.
Fix: Put a CDN in front of your site (Cloudflare, Akamai, Fastly, CloudFront). Cache HTML at the edge where possible. Tune the database. Upgrade outdated CMS versions.
Embedded Maps and Videos
A Google Map or embedded YouTube video on every page can add hundreds of kilobytes and significant JavaScript main-thread work.
Fix: Lazy-load embeds. For maps, consider a static map image with a link to the full interactive map. For videos, use a lightweight “click-to-play” facade that only loads the full embed on interaction.
The Equity Angle
Most agency performance discussions focus on Lighthouse scores and SEO impact. The deeper reason to care is who is being excluded. A page that scores 95 on Lighthouse-desktop but takes 12 seconds to load on a Moto G Power over a 3G connection is failing the people who most need access to government services.
This is conceptually similar to the accessibility argument: performance is part of equal access. The legal pressure is more diffuse than ADA Title II - there is no specific Core Web Vitals law - but the moral and operational case is just as strong.
For smaller local governments with limited budgets, performance is often the area where the smallest investments produce the biggest impact.
A Practical Plan
If you are starting from a failing Core Web Vitals scorecard, here is a sequence that works for most government sites.
- Measure. Connect Google Search Console. Identify the URL groups that are failing and the metrics that are failing.
- Audit images. Find every image over 200 KB. Resize, compress, and convert to modern formats.
- Reserve space. Add explicit
widthandheightattributes to every image and iframe. Add CSS to reserve space for banners. - Defer JavaScript. Add
deferto every non-essential script. Move analytics and tag managers below the LCP element. - Cache and CDN. Put a CDN in front of your site if you do not have one. Enable HTML caching where safe.
- Audit third parties. Remove anything you do not actively need. Lazy-load anything that does not need to run on first paint.
- Test. Re-measure with PageSpeed Insights. Confirm CrUX field data improves over the following 28 days.
How Core Web Vitals Connect to the Bigger Picture
Performance, accessibility, and security all reinforce each other. A page with a clean, minimal CSS architecture is faster, more accessible, and easier to secure. A page weighted down with third-party scripts is slow, often fails keyboard accessibility tests, and is more vulnerable to supply-chain attacks that hardened security headers help mitigate. The overall compliance checklist for government sites should treat performance as a peer of accessibility and security, not an afterthought.
Stop Performance From Regressing
Performance regressions are easy to introduce and hard to detect. A single CMS plugin update, a marketing team adding a new tracking pixel, or a vendor swapping in a heavier widget can quietly push a page from “good” to “poor” Core Web Vitals overnight - and you may not find out until search rankings drop two months later.
Govzu continuously monitors LCP, CLS, INP, and full page weight across your government website, and alerts your team when any URL drops out of the “good” Core Web Vitals thresholds, so performance regressions get caught and fixed within hours, not quarters.